- Quality Improvement
- Apr 30
Discovering Four Types of Fishbone Diagrams

The Minitab Blog
This article originally appeared on The Minitab Blog
Love it or hate it, brainstorming is something we’ve all done at some point in our lives. Those sessions may have been disorderly at times with ideas coming from every direction or totally structured with the help of a particular diagram.
Since the late 1960’s, Ishikawa diagrams have helped millions of people through the process of brainstorming potential causes of an effect or problem and mapping those relationships.
Due to their focus, shape and design, these diagrams are more commonly know as cause-and-effect or fishbone diagrams.
Fishbone diagrams give you a great way to brainstorm within a well-defined structure, but do you know how to fully use them and the types of diagrams that are available?
Each fishbone diagram starts the same: a central problem or effect is placed on the far right of the diagram. Then a line, which is called the “spine”, is drawn straight to the left and branches are added off shooting both above and below it. These branches become known as “affinities” or types of causes from the spine of the central problem or effect. Then specific causes are added to each of the affinities while you are actively brainstorming. This continues until your brainstorming session is complete and you feel satisfied with your fishbone diagram.
Since nearly everyone can use a fishbone diagram to help them brainstorm and there are so many industries and uses, there are a few types different types of fishbone diagrams available. Below are the four most popular:
1. THE SIMPLE FISHBONE
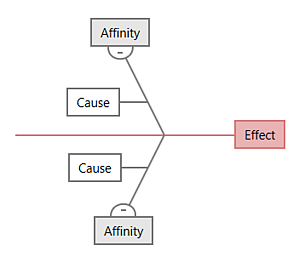
In its most basic form, the fishbone diagram has no predetermined affinities or categories of causes, so you can set and create the affinities that may be unique to your organization or industry.
For example, a health care system may have affinities that wouldn’t be applicable to a manufacturer and vice versa. Even manufacturers could have different affinities due to the array of products they are producing, like food, automotive parts or electronics to name a few.

2. THE 4S FISHBONE
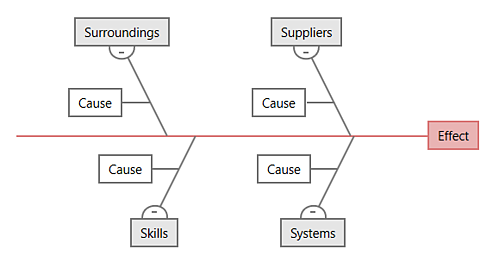
This type of fishbone diagram gets its name from the way it organizes information about potential causes into four common categories: Suppliers, Systems, Surroundings and Skills. It is commonly used in the service industry, but could be used in nearly any industry.

3. THE 8P FISHBONE
This type of fishbone is named after the 8 categories that make it up: Procedures, Policies, Place, Product, People, Processes, Price and Promotion. This variation is also commonly used in the service industry, but can be applied in nearly any type of business or industry.

4. THE MAN MACHINES MATERIALS FISHBONE
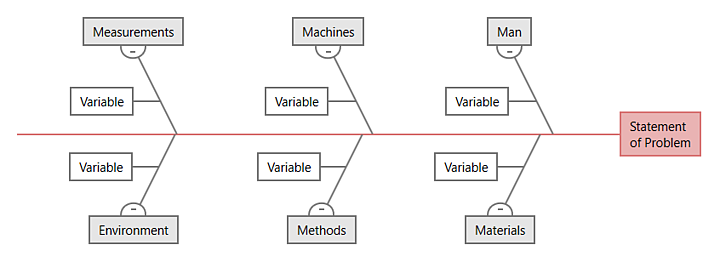
This fishbone diagram variation is most commonly used in manufacturing and allows you to organize potential causes of a problem into these categories: Man, Materials, Machine, Methods, Measurements and Environment. In some cases, two additional categories are included: Management/Money and Maintenance.

Ready to make a fishbone diagram for yourself?
DID YOU GET ALL THAT?
Don’t worry if you haven’t put these to memory yet! Luckily, Minitab Workspace has all four Fishbone templates built in as part of our ultimate visual toolkit. Tap into our collection of powerful visual tools all in one place to elevate your work and achieve the greatest impact in your business with ease.
Our fishbone diagrams are a breeze to use: in just two clicks you can have the entire fishbone outline right at your fingertips. One of the coolest things about our diagrams is that if you don’t like the location of an attribute or cause, you can drag and drop it where you need it to be. Try doing that with your pen and paper!
This article originally appeared on The Minitab Blog
Related Posts

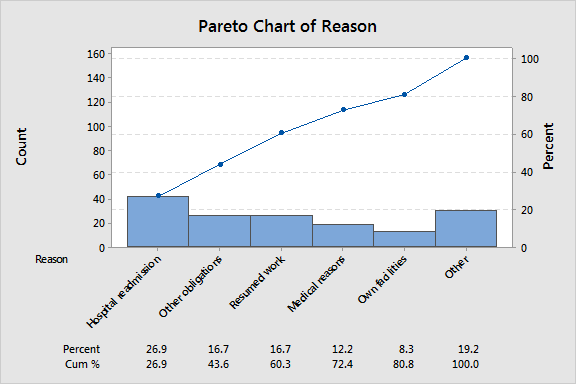
How to Avoid Messing Up Your Pareto Charts
Pareto charts are a special type of bar chart you can use to prioritize almost anything. This makes them very useful in making sound decisions.
- Apr 30

How to Use Value Stream Maps in Healthcare
A value stream map (VSM) is a tool that helps to visualize every step or action required to complete a process from start to finish.
- Apr 30