MSS_NEW-logo

POWERFUL STATISTICAL SOFTWARE EVERYONE CAN USE

Predict. Visualize, analyze and harness the power of your data to solve your toughest challenges and eliminate mistakes before they happen. Now from anywhere on the cloud.

Minitab 20 Video overlay
Play Video
MSS_NEW-logo

POWERFUL STATISTICAL SOFTWARE EVERYONE CAN USE

Predict. Visualize, Analyze, and Harness the power of your data to solve your toughest business challenges from anywhere on the cloud.

Graph_Builder

Learn How Minitab Can Support Your Analytics Journey

Harness the power of statistics.

Data is everywhere these days, but are you truly taking advantage of yours? Minitab Statistical Software can look at current and past data to find trends and predict patterns, uncover hidden relationships between variables, visualize data interactions and identify important factors to answer even the most challenging of questions and problems. Visualizations are good, but pair them with analytics to make them great. With the power of statistics and data analysis on your side, the possibilities are endless.

Discover

Predict

Achieve

discover-img-1

Discover

Regardless of statistical background, Minitab can empower all parts of an organization to predict better outcomes, design better products and improve processes to generate higher revenues and reduce costs. Only Minitab offers a unique, integrated approach by providing software and services that drive business excellence now from anywhere thanks to the cloud.

Key statistical tests include t tests, one and two proportions, normality test, chi-square and equivalence tests.

Enjoy new levels of productivity and collaboration, whether you are accessing Minitab on a desktop or on the cloud. See everything new 

Predict

Access modern data analysis and explore your data even further with our advanced analytics and open source integration. Skillfully predict, compare alternatives and forecast your business with ease using our revolutionary machine learning techniques.

Use classical methods in Minitab Statistical Software, integrate with open-source languages R or Python, or boost your capabilities further with machine learning algorithms like Classification and Regression Trees (CART®) or TreeNet® and Random Forests®, now available in Minitab’s Predictive Analytics Module.

predict-img-1
timeseriesplot-achieve

Achieve

Seeing is believing. Deciding which graph best displays your data and supports your analysis is fast and easy with GRAPH BUILDER.

Our new interactive tool with an easy-to-browse gallery lets you view and explore multiple graph options without re-running your analysis. Using the same selection of data each time, GRAPH BUILDER seamlessly updates from bar charts to correlograms to heat maps and more, so you can focus on choosing the best visual for your insights.

From Beginner to Advanced - Expert Guidance Every Step of the Way Minitab Assistant

Minitab’s Assistant is a built-in interactive feature that guides you through your entire analysis and even helps you interpret and present results.

Ready for a demo of Minitab Statistical Software?

Minitab - Your Partner in Your Analytics Journey

Comprehensive set of statistics for data analysis in your organization or role.
Visualizations and the right statistical methods enable data-driven decisions leading to better decisions and better business outcomes.

Measurement System Analysis

  • Gage studies
  • Attribute agreement analysis

Control charts

  • Variable, attribute
  • Multivariate
  • Time weighted
  • Rare event charts

Capability Analysis

  • Capability Sixpack

Acceptance Sampling

Tolerance Intervals

Distribution Analysis

  • Arbitrary censoring (left, right or interval censoring)
  • Weibull analysis
  • Censored data

Test Plans

  • Demonstration
  • Estimation (Sample Size for Distribution Analysis)
  • Accelerated Life Test

Warranty Analysis

Reparable Systems Analysis

Regression w/ life data

Probit Analysis

Design of Experiments (DOE)

  • Screening designs
  • Full factorial
  • Fractional factorial
  • Response surface
  • Mixture
  • Taguchi

Power and Sample Size

  • Tolerance Intervals
  • Normal and non-normal

Correlation

Statistical Modeling

  • Regression
  • Nonlinear
  • Non-linear regression
  • Multivariate Models
  • Cluster Analysis
  • Classification and Regression Trees (CART®)
  • TreeNet®
  • Random Forests®

Time Series Analytics

  • ARIMA modeling
  • Time series / forecasting

Visualizations

  • Scatterplots
  • Heatmaps
  • Boxplots

Multivariate Methods

Chi-Square Test for Association

Stage 1 Process Design

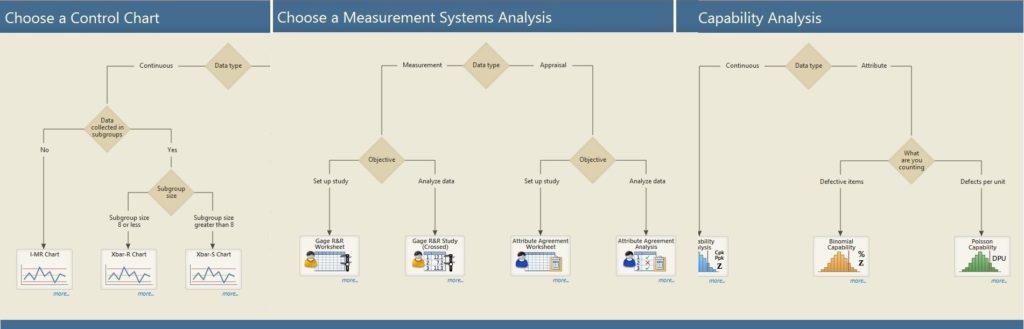
      • Measurement Systems Analysis
      • Hypothesis testing
      • Regression / ANOVA
      • Process Capability

Stage 2 Process Qualification

      • Control charts
      • Capability analysis
      • Tolerance Intervals

Stage 3 Continued Process Validation

      • Measurement System Analysis
      • Acceptance sampling
      • Control charts

Ready to try the latest Minitab Statistical Software?

Book Your Slot !

We value your privacy and will maintain as per our Privacy Policy.