- Statistics
- Jul 06
Is your Sample Size enough for doing the Analysis?

I guess this is an important question we should ask ourselves before doing any kind of analysis. We should know the sample size required to do the analysis. Say, if we collect more samples than required – what will happen? We will waste our resources and time. Thus enhanced cost and complexity. On the other hand, if we collect fewer samples than our test may fail and hence less accuracy on results. On an extreme note, our test may fail to detect the important effect and could not meet the test objective. Hence we should determine the optimum sample size required for analysis.

Concept of Power and Sample Size
Let’s discuss a very basic example to understand “why the determination of sample size is important in data analysis?” Generally, salt is a very important factor to determine the taste of food. We all know how much work is needed during the cooking process, right! Now, the hard work will be paid off if only we get a significant result i.e. food must be tasty. Say, if we put more salt than required or less salt than required – what will happen? We all know the consequence, right!
To avoid such circumstances in data analysis, “Concept of Power and sample size” comes into play.
What is a Power and Sample size?
It is a concept of estimating adequate sample size required for data analysis to achieve significant results. We already know sample size – it is a count of individuals or samples required for analysis. But you might be thinking about the term “power”. Power analysis tells us a number of sample size required to avoid any type of error in decision making. In other words, we can say that it is a probability of making the right decision irrespective of errors.
I would like to mention a few factors which affect the power analysis are sample size, variability and alpha value (level of significance). We should choose adequate samples so it will not hamper the power analysis. There could be a variation (spreadness of a data) in a process and thus results in a random error. We should use proper sampling procedure and measurement analysis to minimize variation in a process. Alpha value represents the probability of making the wrong decision when it is actually true. The common alpha values are 1% (0.01) and 5% (0.05).

Power Curve
- Example
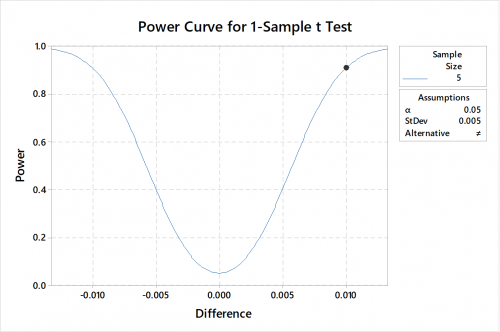
In a ball bearing manufacturing industry, engineers are concerned that the bearing diameter has shifted away from the target of 0.6 cm. They consider a difference of 0.01 cm to warrant adjusting the equipment. From the historical data, the standard deviation is 0.005 cm.
Now the question is “How much data is needed for analysis?”
With reference from the power curve – for doing the analysis we need a sample size of 5 where alpha value is 0.05 and power is 0.9.
What are the common power values used?
When determining the sample size, we should put the optimum power value as to avoid any kind of error. Suppose in a test, if it has low power value than it might fail to detect an effect and if it has a higher power value than small effects might seem to be significant. Some of the common power values used are 0.8 and 0.9. Let’s say if your study has 90% power than it has a 90% chance of detecting an effect that exists.
There are various ways to determine power and sample size. The easiest and simplest way to determine it is by using the “Power and Sample size” option in MINITAB. With Recent Release, Minitab now Available on both Desktop and the Cloud.
NB – Want to learn, How to run Power & Sample Size Analysis in Minitab Software? Attend our Minitab Certified Training Program, starting from basic to advanced level. Some of the Minitab software training certified courses are Minitab Essentials, Statistical Tools for Pharmaceuticals, Statistical Quality Analysis & Factorial Designs, etc. Apart from Minitab training, we also conduct basic and advanced Statistical training. Some of the Statistical training certified courses are Predictive Analytics Masterclass, Essential Statistics For Business Analytics, SPC Masterclass, DOE Masterclass, etc.
Related Posts

How Statistics Applications can add value to the Industrial Manufacturing?
A brief illustration of the applications of statistical methods in the manufacturing industry. Statistics, we heard a lot about it…
- Feb 08