- Data Analysis
- Aug 06
Why Choose Minitab as your Statistical Data Analytics Software?
Since we are living in a data-driven society, where Data Analytics have taken centre stage in recent years. Data Analytics helps us to extract valuable information from data and support decision making strategy in an organisation. The importance of data analytics is very well known in all areas. We use data analytics to find new improvement opportunities in an organisation irrespective of industrial types. It is applicable in all the department of an organisation viz. manufacturing, sales, finance, marketing, production, supply chain, R&D and so on.
Minitab - Powerful statistical software everyone can use
However, there are challenges ahead for organisations to recruit an employee who has –
- Good programming and problem-solving skills
- Adequate statistical knowledge
In simpler words, there is a huge gap between the present and required analytics skills workforce. Moreover, organisations want the right analytical tools which are easy to use, better & faster, reliable and supported by technical experts. Here, Minitab comes into play which overcomes all these challenges and gives meaningful solutions to your toughest business problems.
Let’s find more about Minitab….
What is Minitab?
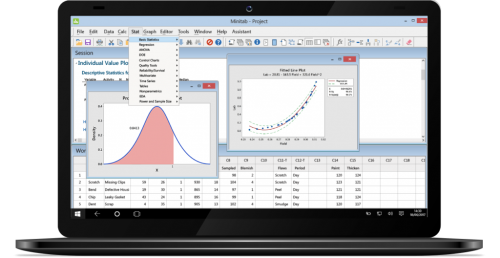
Minitab is a data analytics software which delivers statistical analysis, visualizations, predictive and improvement analytics to enable data-driven decision making. Regardless of statistical background and programming skills, organisations can use Minitab to analyse small and large datasets for quality improvement, process validation, product development and so forth.
Features
- Easier data preparation - Prepare your data for analysis even easier. Import your data on a click from excel, database or any text file.
- Effective data visualization - Visualize your data in a simple graphical output; scatterplots, boxplots, dotplots, histograms, time series plots, etc. Understand the patterns, trends and outliers in data.
- Effortless presentation - Export graphs and output directly to Word or PowerPoint. Easily create presentations and share your insights with your clients, colleagues and management.
- Expert Guidance - New to data and analytics. No worries, with the help of Minitab Assistant and Quality Trainer, you can do analytics easily.
Key Highlights
I want to highlight some of the major tools which are available in Minitab for significant processes, which helps to increase efficiency and drive organisational excellence.
- Quality - For quality improvement, tools available are Measurement system analysis (MSA), Control Charts, Capability Analysis, etc.
- Process Validation - For process validation in all the stages i.e. process design, process qualification and continued process validation, tools available are MSA, Hypothesis testing, Regression, Control charts, Acceptance Sampling, etc.
- Product Development - For product development, tools available are Design of Experiments (DOE), Power & sample size, and tolerance intervals.
- Business Analytics - For business analytics, tools available are correlation, statistical modelling & regression, CART®, TreeNet®, Random Forests ®, MARS ®, time-series analytics, multivariate methods, etc.
- Reliability Engineering - For reliability engineering, tools available are distribution analysis, warranty analysis, probit analysis and so forth.
Few of the organisations, I would like to mention where Minitab has been used to overcome various process challenges.
- Ford Motor Company - Minitab helped Ford to identify and fix the manufacturing process of carpets to eliminate brush marks. As a result, it enhanced Ford's commitment to process excellence and quality improvement.
- Boston Scientific - They used Minitab to evaluate the pouch-sealing process in order to define optimum process conditions and reduce material costs. Adopting the new process, they were able to reduce costs and save more resources.
- Akron Children’s Hospital - They used Minitab to identify causes of billing defects in their billing process and to optimize the process. After implementing the new process, they were able to reduce defects to 13.3%.
Note – With Recent Release, Minitab now Available on both Desktop and the Cloud. Python Integration in Minitab. We can run Python scripts easily in Minitab and extend our analytical capabilities by collaborating with the Data Analyst, Data Engineer, Machine Learning Engineer and the Data Science Generalist.
NB – Want to learn, How to use & explore Minitab Software? Attend our Minitab Certified Training Program, starting from basic to advanced level. Some of the Minitab software training certified courses are Minitab Essentials, Statistical Tools for Pharmaceuticals, Statistical Quality Analysis & Factorial Designs, etc. Apart from Minitab training, we also conduct basic and advanced Statistical Training & Workshops. Some of the Statistical training certified courses are Predictive Analytics Masterclass, Essential Statistics For Business Analytics, SPC Masterclass, DOE Masterclass, etc.
Related Posts
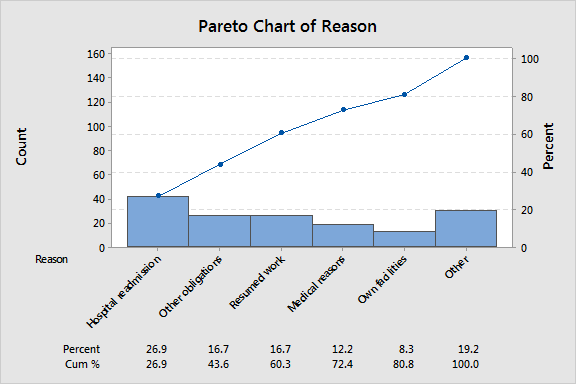
How to Avoid Messing Up Your Pareto Charts
Pareto charts are a special type of bar chart you can use to prioritize almost anything. This makes them very useful in making sound decisions.
- Apr 30
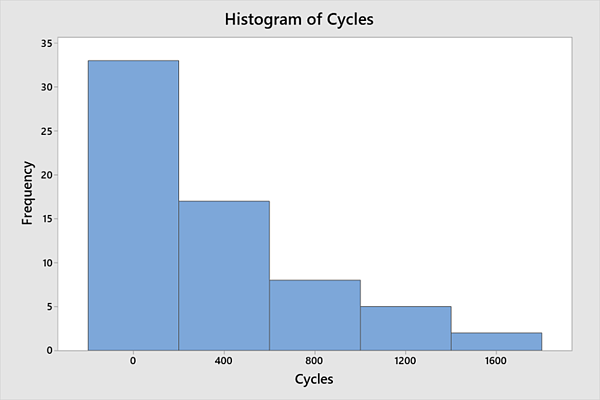
3 Ways Minitab Makes Plotting Histograms More Automatic and Easier than Excel
Histograms are great for summarizing several statistics. Let’s look at three ways you can do more with histograms…
- Apr 28